Vaccinated English Adults Under 60 Are Dying at Twice the Rate of Unvaccinated People the Same Age
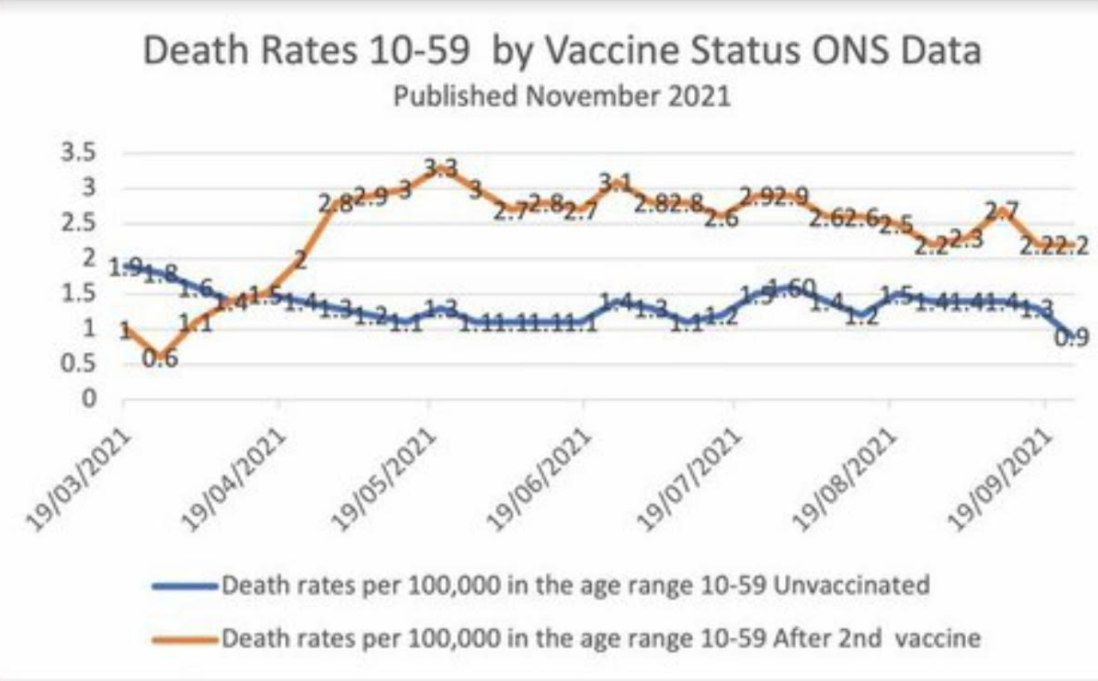
The brown line represents weekly deaths from all causes of vaccinated people aged 10-59, per 100,000 people. The blue line represents weekly deaths from all causes of unvaccinated people per 100,000 in the same age range.
November 20, 2021 | Source: Unreported Truths | by Alex Berenson
And have been for six months. This chart may seem unbelievable or impossible, but it’s correct, based on weekly data from the British government.
The brown line represents weekly deaths from all causes of vaccinated people aged 10-59, per 100,000 people.
The blue line represents weekly deaths from all causes of unvaccinated people per 100,000 in the same age range.